

TypeGraph 0.35: Faster Almost Everywhere
A 2M-row bulk load into SQLite was still running after 4.5 hours with no sign
of finishing, and the cause turned out to be a statistics refresh. After a
large batch, bulkCreate and bulkInsert automatically run SQLite’s ANALYZE
so the query planner has fresh numbers, but that ANALYZE was bare and
unscoped: it scanned every table in the database file (not just TypeGraph’s),
with no limit, after every big batch. If you stream a load through repeated
bulkInsert() calls, each refresh costs more than the last and the total goes
quadratic.
It’s now scoped to TypeGraph’s own tables and bounded with PRAGMA analysis_limit, the way the Postgres version already behaved. A 100k-row
reproduction of the same shape finishes in about 8 seconds, and the last
batch costs only about twice what the first one did.
0.35 has about 35 fixes like that one, and below are the ones that matter most, with numbers.
Bulk writes
Section titled “Bulk writes”These four changes stack on top of each other for anything that writes a lot of rows:
- SQLite pragmas at open.
createLocalSqliteBackendnow turns onjournal_mode=WAL,synchronous=NORMAL, and a busy timeout by default. better-sqlite3’s own defaults pay a full fsync per write in rollback-journal mode. Single-operation writes on file-backed databases are roughly 5x faster. - Real bind-parameter limits. The backend used to assume SQLite’s old 999-parameter limit on every driver. It now asks the driver (32,766 for better-sqlite3, 100 for Cloudflare D1), so batches on better-sqlite3 use ~33x fewer statements: 111-row chunks became 3,640-row chunks.
bulkCreate/bulkInsertbatched end to end. Existence checks, uniqueness checks, and fulltext/embedding writes each happen once per batch instead of once per row: ~1,600 → ~4,100 rows/s (~2.6x).importGraphbatched the same way: ~26k → ~96k entities/s (~4x). The defaultbatchSizealso went from 100 to 1,000, and now actually applies. A schema-parsing gap meant the old default was silently ignored. That change alone took a 20k-node, 5k-edge Postgres import from 1,515ms to 781ms.
There’s also a new walAutocheckpointPages option for tuning WAL checkpoints
during heavy loads. On its own it cut a 2M-row load’s time by more than half
at the largest scale tested.
The regression, and fixing it properly
Section titled “The regression, and fixing it properly”This one’s on me. 0.34 fixed a real correctness bug where “current” reads compared against the database’s clock instead of the application’s, so when the two clocks drifted (app and database on separate hosts, which is normal), a row you’d just created could be invisible to the very next read. The fix was to bind the read instant fresh every time a query compiled, which was correct but had two problems I didn’t catch until this release.
It was slow. Every execute() recompiled the query from scratch,
including the .prepare()-once, .execute()-many pattern that exists
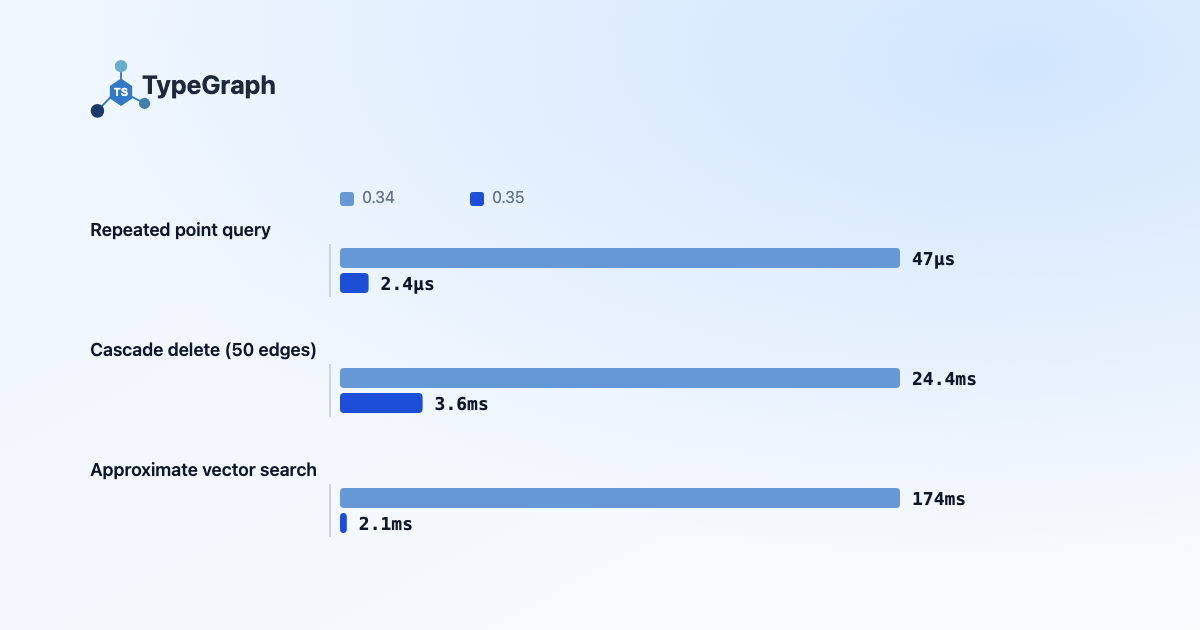
specifically to avoid that. A repeated point query cost about 47µs.
It was also, briefly, worse than the bug it fixed. The query builders
cached their compiled SQL text across calls, so a prepared query froze “now”
at the moment it first compiled. Every row created after that had a later
valid_from than the frozen instant, and stayed invisible to that query
forever. It reproduced in a single process on the very next insert after
preparing a query, whereas the clock-skew bug at least needed two hosts.
0.35 fixes both the same way: the SQL text is cached, and only the “now”
instant is re-bound as a parameter on each call. The repeated point query
went from 47µs to 2.4µs (~20x), and a row created after .prepare()
shows up on the next .execute().
I’m not going to bury that in a changelog line. If you’re on 0.34 and use
.prepare(), upgrade.
Point operations and traversals
Section titled “Point operations and traversals”- CRUD statements reuse the prepared-statement cache. On synchronous
drivers, Drizzle’s
db.all()/db.run()re-prepared every statement. They now go through the same cached path the query engine uses. Single creates: ~18.3k → ~28.8k ops/s (~1.6x). - Cascade deletes remove edges in batches instead of one statement per edge. A 50-edge cascade on local Postgres: 24.4ms → 3.6ms.
degree()can use the index again. The direction filter compiled to a shape neither edge index could seek. Now it matches the index prefix: 0.30ms → 0.06ms on Postgres 18, and on Postgres 17 and earlier it no longer falls back to scanning the whole partition.- Subgraph extraction is ~4x faster on Postgres (322ms → 82ms on a depth-3 stress shape). The recursive traversal runs once instead of twice, and the resulting ids go in as a single array parameter.
Search
Section titled “Search”- Hybrid search is one SQL statement instead of two searches plus fusion in JavaScript, with the candidate filter computed once and shared. Filtered hybrid search at 5k documents: 26.5ms → 17.1ms.
- Postgres fulltext can use its GIN index. The query referenced the language from a per-row column, which kept the planner off the index. It’s now a constant: 12.9ms → 2.3ms at 5,000 documents.
- Exact
.similarTo()on SQLite uses sqlite-vec’s KNN. It’s brute force in C, so results are identical, just faster: 489ms → 124ms for top-10 over 50k 384-dimension embeddings. - Approximate vector search on Postgres uses the ANN index now. A stray
DISTINCTkept the planner off the ordered index scan, and the inline path wasn’t applying the same pgvector tuning as the search API. Together: 174ms → 2.1ms, at 0.995 recall.
That last area also had a correctness bug. Exact .similarTo() was
quietly approximate whenever a matching ANN index existed, because
pgvector will happily answer an exact-looking ORDER BY ... LIMIT k from an
HNSW or IVFFlat index. Under a selective filter at 50k documents, measured
recall dropped as low as 0.000, which means the results were simply wrong.
The exact path now forces a true scan regardless of which indexes exist.
Found by benchmarking against real graph databases
Section titled “Found by benchmarking against real graph databases”Two of these fixes came from running the LDBC Social Network Benchmark
against Neo4j and LadybugDB, not from profiling TypeGraph on its own. Edge
bulkCreate / bulkInsert had an N+1 endpoint check that made each batch
slower as the graph grew (~90ms → ~630ms per batch). And the default edge
traversal indexes were missing columns a join needed to stay index-only,
which didn’t show up until the table outgrew the page cache and then hit a
multi-second latency cliff. The
full benchmark writeup
covers where TypeGraph wins and where it doesn’t.
If you’re upgrading an existing database, note that the wider edge
indexes only appear on fresh databases. CREATE INDEX IF NOT EXISTS does
nothing when an index with that name exists, even with a different column
list, so an upgraded deployment keeps the narrow index until you rebuild it.
Performance → Indexes has the exact DROP /
CREATE INDEX CONCURRENTLY steps for both backends.
Also in 0.35
Section titled “Also in 0.35”.aggregate({...}).orderBy(key, direction?), so “top N groups by count” no longer means fetching every group and sorting in JavaScript.- Breaking, ontology:
implies(edgeA, edgeB)now checks that the two edges’ endpoint kinds are compatible. This also runs when a persisted schema loads, so check saved schemas before rolling out, not just source.
Try it
Section titled “Try it”- Performance overview and Indexes
- Changelog: the full 0.35.0 entry
- GitHub
Stay in the loop
Occasional updates on new features, guides, and releases. No spam.